Instance unavailability
What happens when one of our services goes down? Most teams have a dedicated alert that monitors instance availability. So when something breaks, they usually get two alerts: one for the service disruption (if it happens), and one for the instance becoming unavailable. If those are the only two alerts, it's pretty straightforward to connect the dots and see that the unavailable instance is the root cause.
But when multiple things are going wrong at the same time, it gets harder to figure out what caused what.
Let’s walk through a failure scenario and see how we can automatically detect causality.
Scaling a Kubernetes deployment to 0 replicas
kubectl scale --replicas=0 deployment/recommendations
Let’s see how this impacts the rest of the system:

As shown above, our frontend SLIs (Service Level Indicators) spike — both in latency and error rates. Now, let’s use Coroot to investigate what happened and identify the root cause.
Root Cause Analysis
Here’s a summary of the AI-powered root cause analysis performed by Coroot Enterprise Edition (preview version).

Anomaly summary
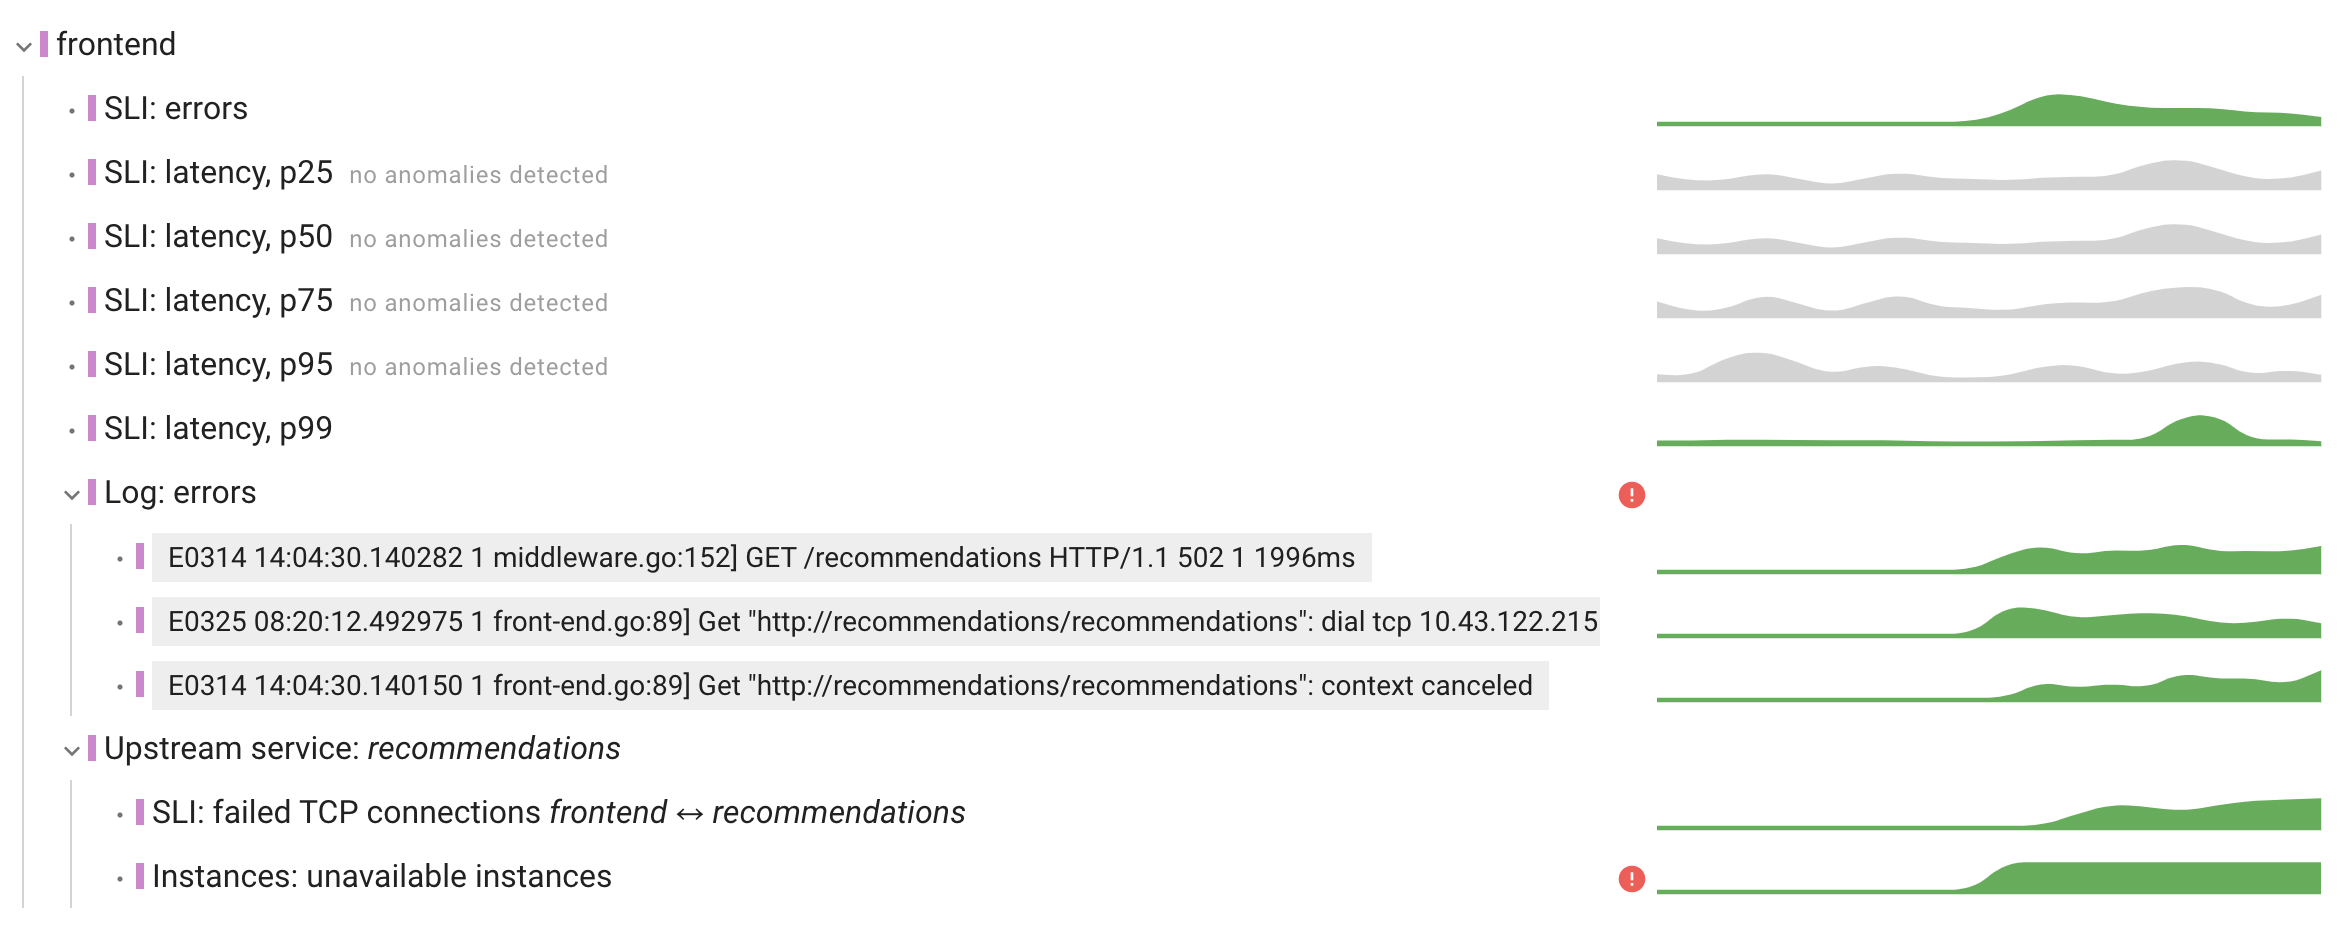
The frontend service is experiencing failed requests (up to 0.2 per second) and significant latency spikes at p99 (up to 1.14 seconds). The lower percentiles (p25-p95) remain stable, indicating that this issue affects only a small portion of requests.
Issue propagation paths
frontend → recommendations
Key findings and Root Cause Analysis
The root cause appears to be connectivity issues with the recommendations service:
- Failed TCP connections from frontend to recommendations service (up to 76.7% failure rate)
- Log entries show connection refused errors when trying to reach recommendations service
- Some instances of the recommendations service were unavailable
Remediation
- Investigate why recommendations service instances are becoming unavailable (possible pod crashes or terminations)
- Review the recommendations service's resource allocation and scaling configuration
- Implement circuit breaker pattern in frontend service to handle recommendations service failures gracefully
- Consider adding retry mechanisms with exponential backoff for failed requests
Relevant charts

How it works
Coroot's Root Cause Analysis (RCA) is performed in two steps:
- Analyzing the Model of the System: Coroot starts with the affected app, examining its metrics and logs to identify patterns linked to the anomaly. It then explores dependencies - services, databases, and infrastructure, tracing the issue through the system to pinpoint the root cause.
- Summarizing the Findings: Once Coroot gathers all the details, it sends the context to an LLM, which generates a clear summary and highlights the most important charts for faster troubleshooting.
Here’s a detailed RCA report showing how Coroot analyzed this anomaly. It might look complex, but it’s useful as evidence, making it easy to cross-check the relevant anomalies.

Why Service Map Traversal Matters
Coroot didn’t just detect that the recommendations service was down — it proved that it was the reason behind the frontend errors.
Just checking which services are unavailable isn't enough for precise Root Cause Analysis — it can easily lead to false positives. Instead, Coroot traverses the service dependency graph to confidently identify causality:
- We see failed requests in frontend
- At the same time, frontend couldn’t connect to recommendations — that’s a direct cause
- And some recommendations instances were unavailable — likely causing those refused connections
So instead of guessing whether multiple incidents are related, we know they are.
Conclusion
When multiple things fail at once, figuring out the root cause can be tricky. It's not just about knowing that something is broken—it's about understanding why. By analyzing how issues propagate through your system and correlating symptoms with actual causes, you can move from guessing to knowing. That’s the key to faster, more effective incident response.