Postgres: primary server failure
In our lab, we use a highly available Postgres cluster managed by the Zalando operator. Under the hood, the operator relies on Patroni to monitor cluster instances and handle automatic failover.
Let's examine what happens when the primary Postgres server becomes unavailable and how it affects our services.
Deleting the Pod running the primary Postgres server
The operator stores the current role of each Pod in its labels. Kubernetes services use these labels to route client connections to the primary or replicas. This allows us to easily identify and delete the Pod that is currently the primary:
kubectl delete pod -l spilo-role=master,cluster-name=odb-postgres
Now, let’s check the effects on our apps:
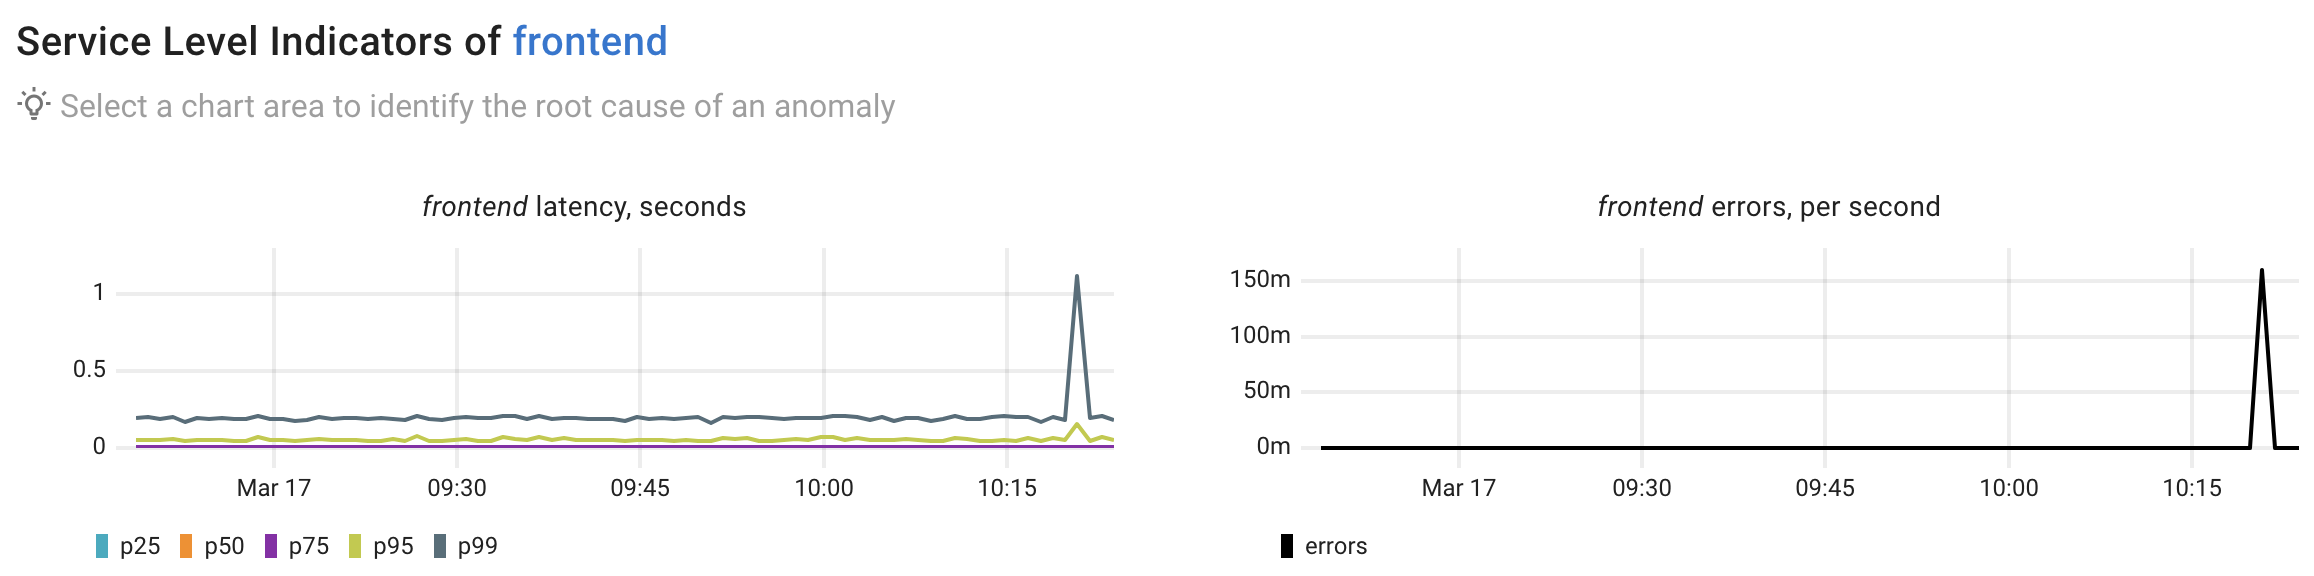
We observe clear anomalies in the frontend's latency and error rates. Next, let’s use Coroot to perform root cause analysis and explain these anomalies.
Root Cause Analysis
Here’s a summary of the AI-powered root cause analysis performed by Coroot Enterprise Edition (preview version).
Anomaly summary
The frontend service is experiencing increased error rates (up to 0.16 errors per second) and elevated latencies, particularly in higher percentiles (p95 up to 156ms and p99 up to 1.12s).
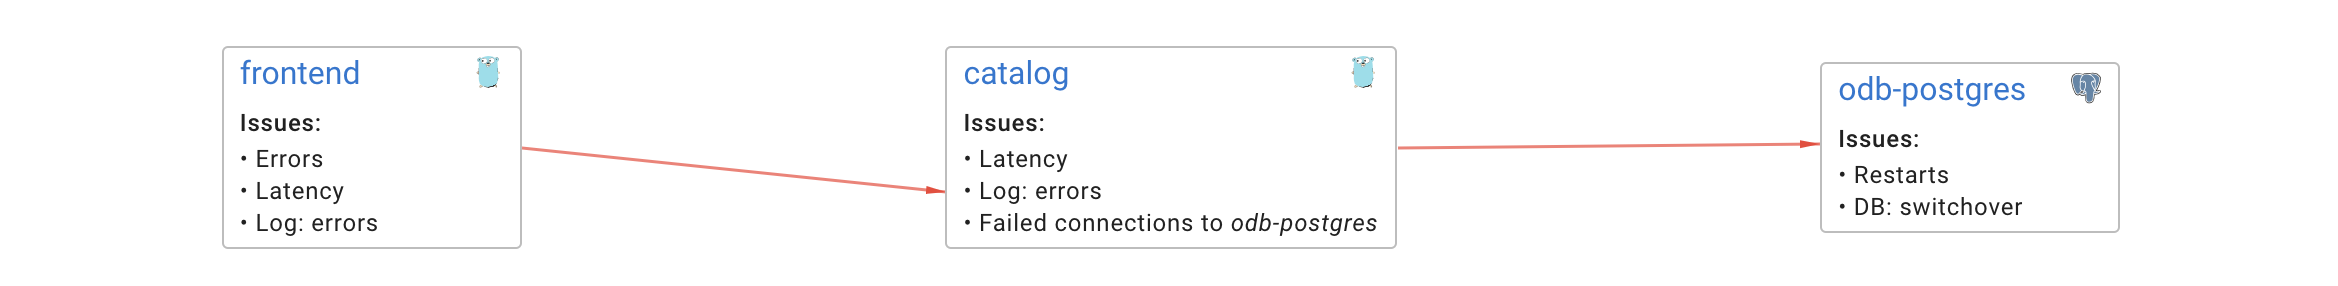
Issue propagation paths
frontend → catalog → odb-postgres
Key findings and Root Cause Analysis
The root cause has been traced to the odb-postgres database service:
- A primary server switchover occurred in the PostgreSQL cluster
- Database instances were restarted
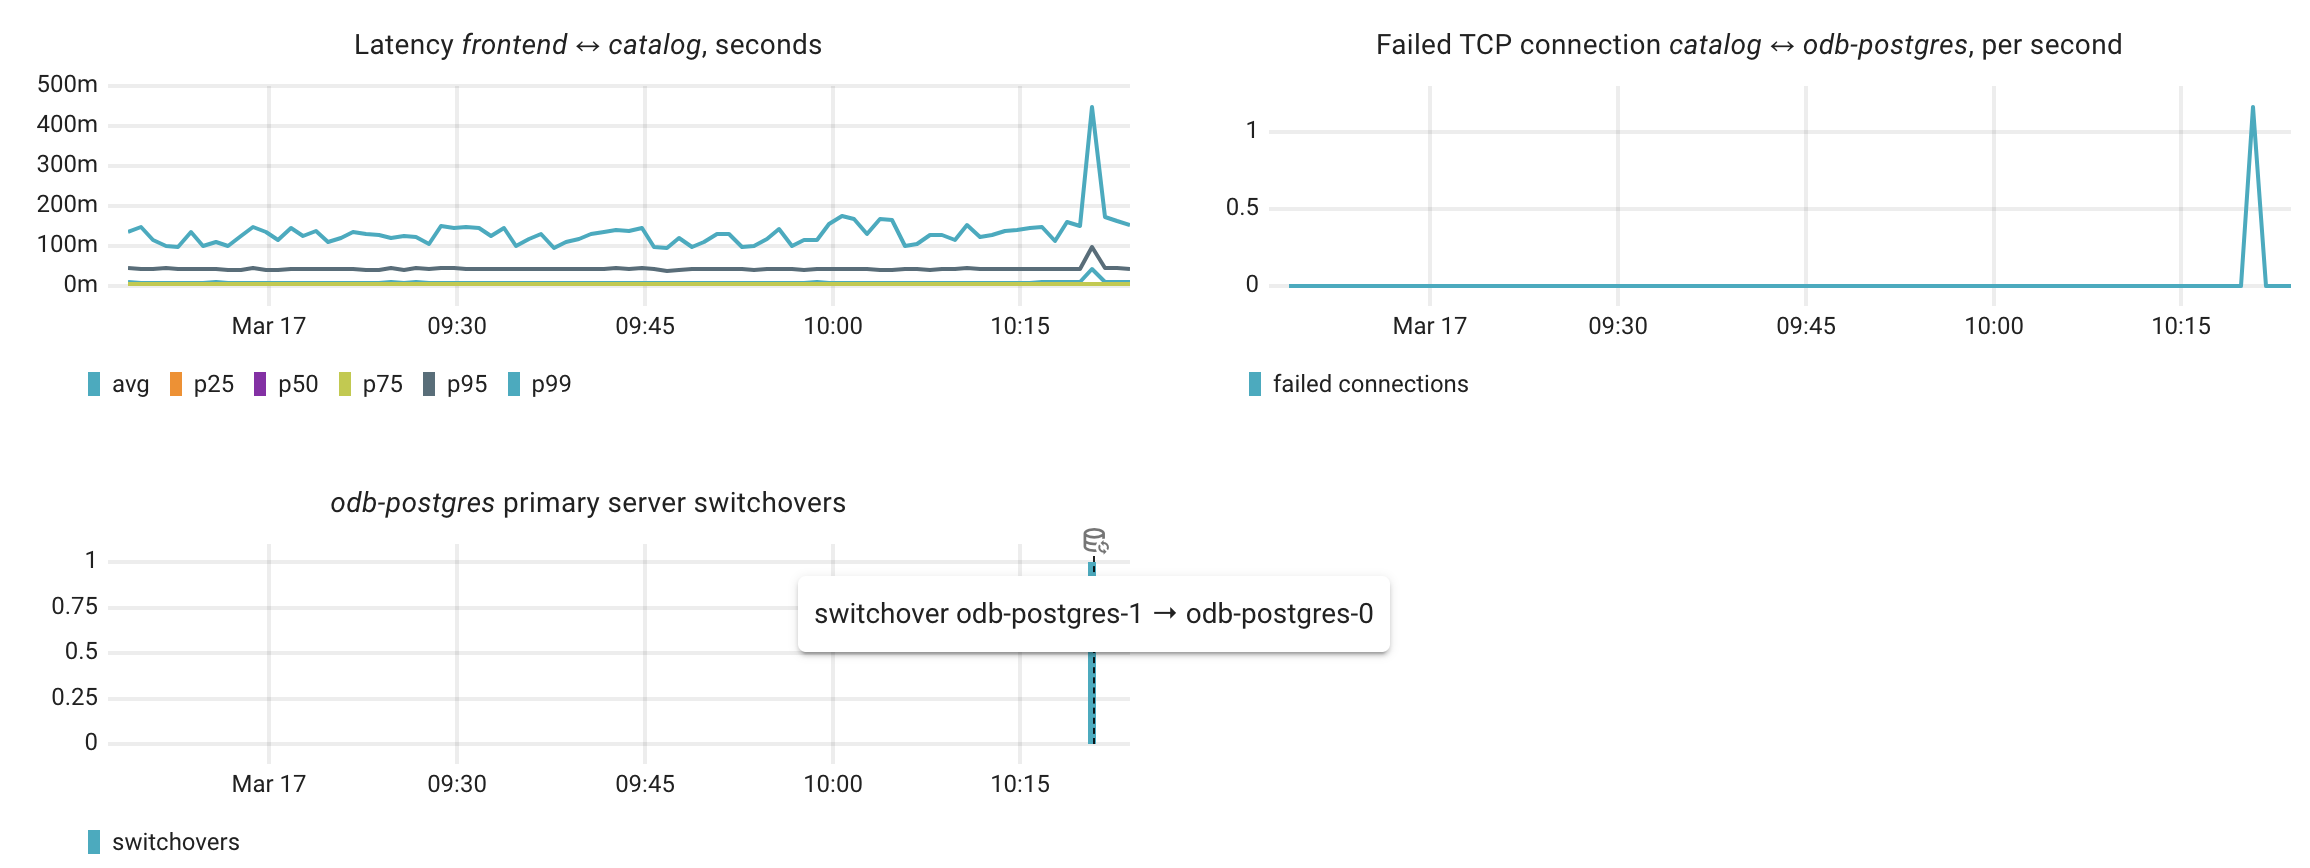
- The catalog service experienced connection failures to the database with errors indicating system shutdown and administrator commands
- Failed TCP connections from catalog to odb-postgres peaked at 1.17 per second
This caused catalog service to return 500 and 502 errors, which propagated to the frontend
Remediation
- Implement retry mechanisms in the catalog service for database connections
- Add connection pooling to handle database failovers more gracefully
- Consider implementing circuit breakers to prevent cascade failures
- Schedule database maintenance during off-peak hours
- Implement proper database failover procedures to minimize downtime
Relevant charts
How it works
Coroot's Root Cause Analysis (RCA) is performed in two steps:
- Analyzing the Model of the System: Coroot starts with the affected app, examining its metrics and logs to identify patterns linked to the anomaly. It then explores dependencies - services, databases, and infrastructure, tracing the issue through the system to pinpoint the root cause.
- Summarizing the Findings: Once Coroot gathers all the details, it sends the context to an LLM, which generates a clear summary and highlights the most important charts for faster troubleshooting.
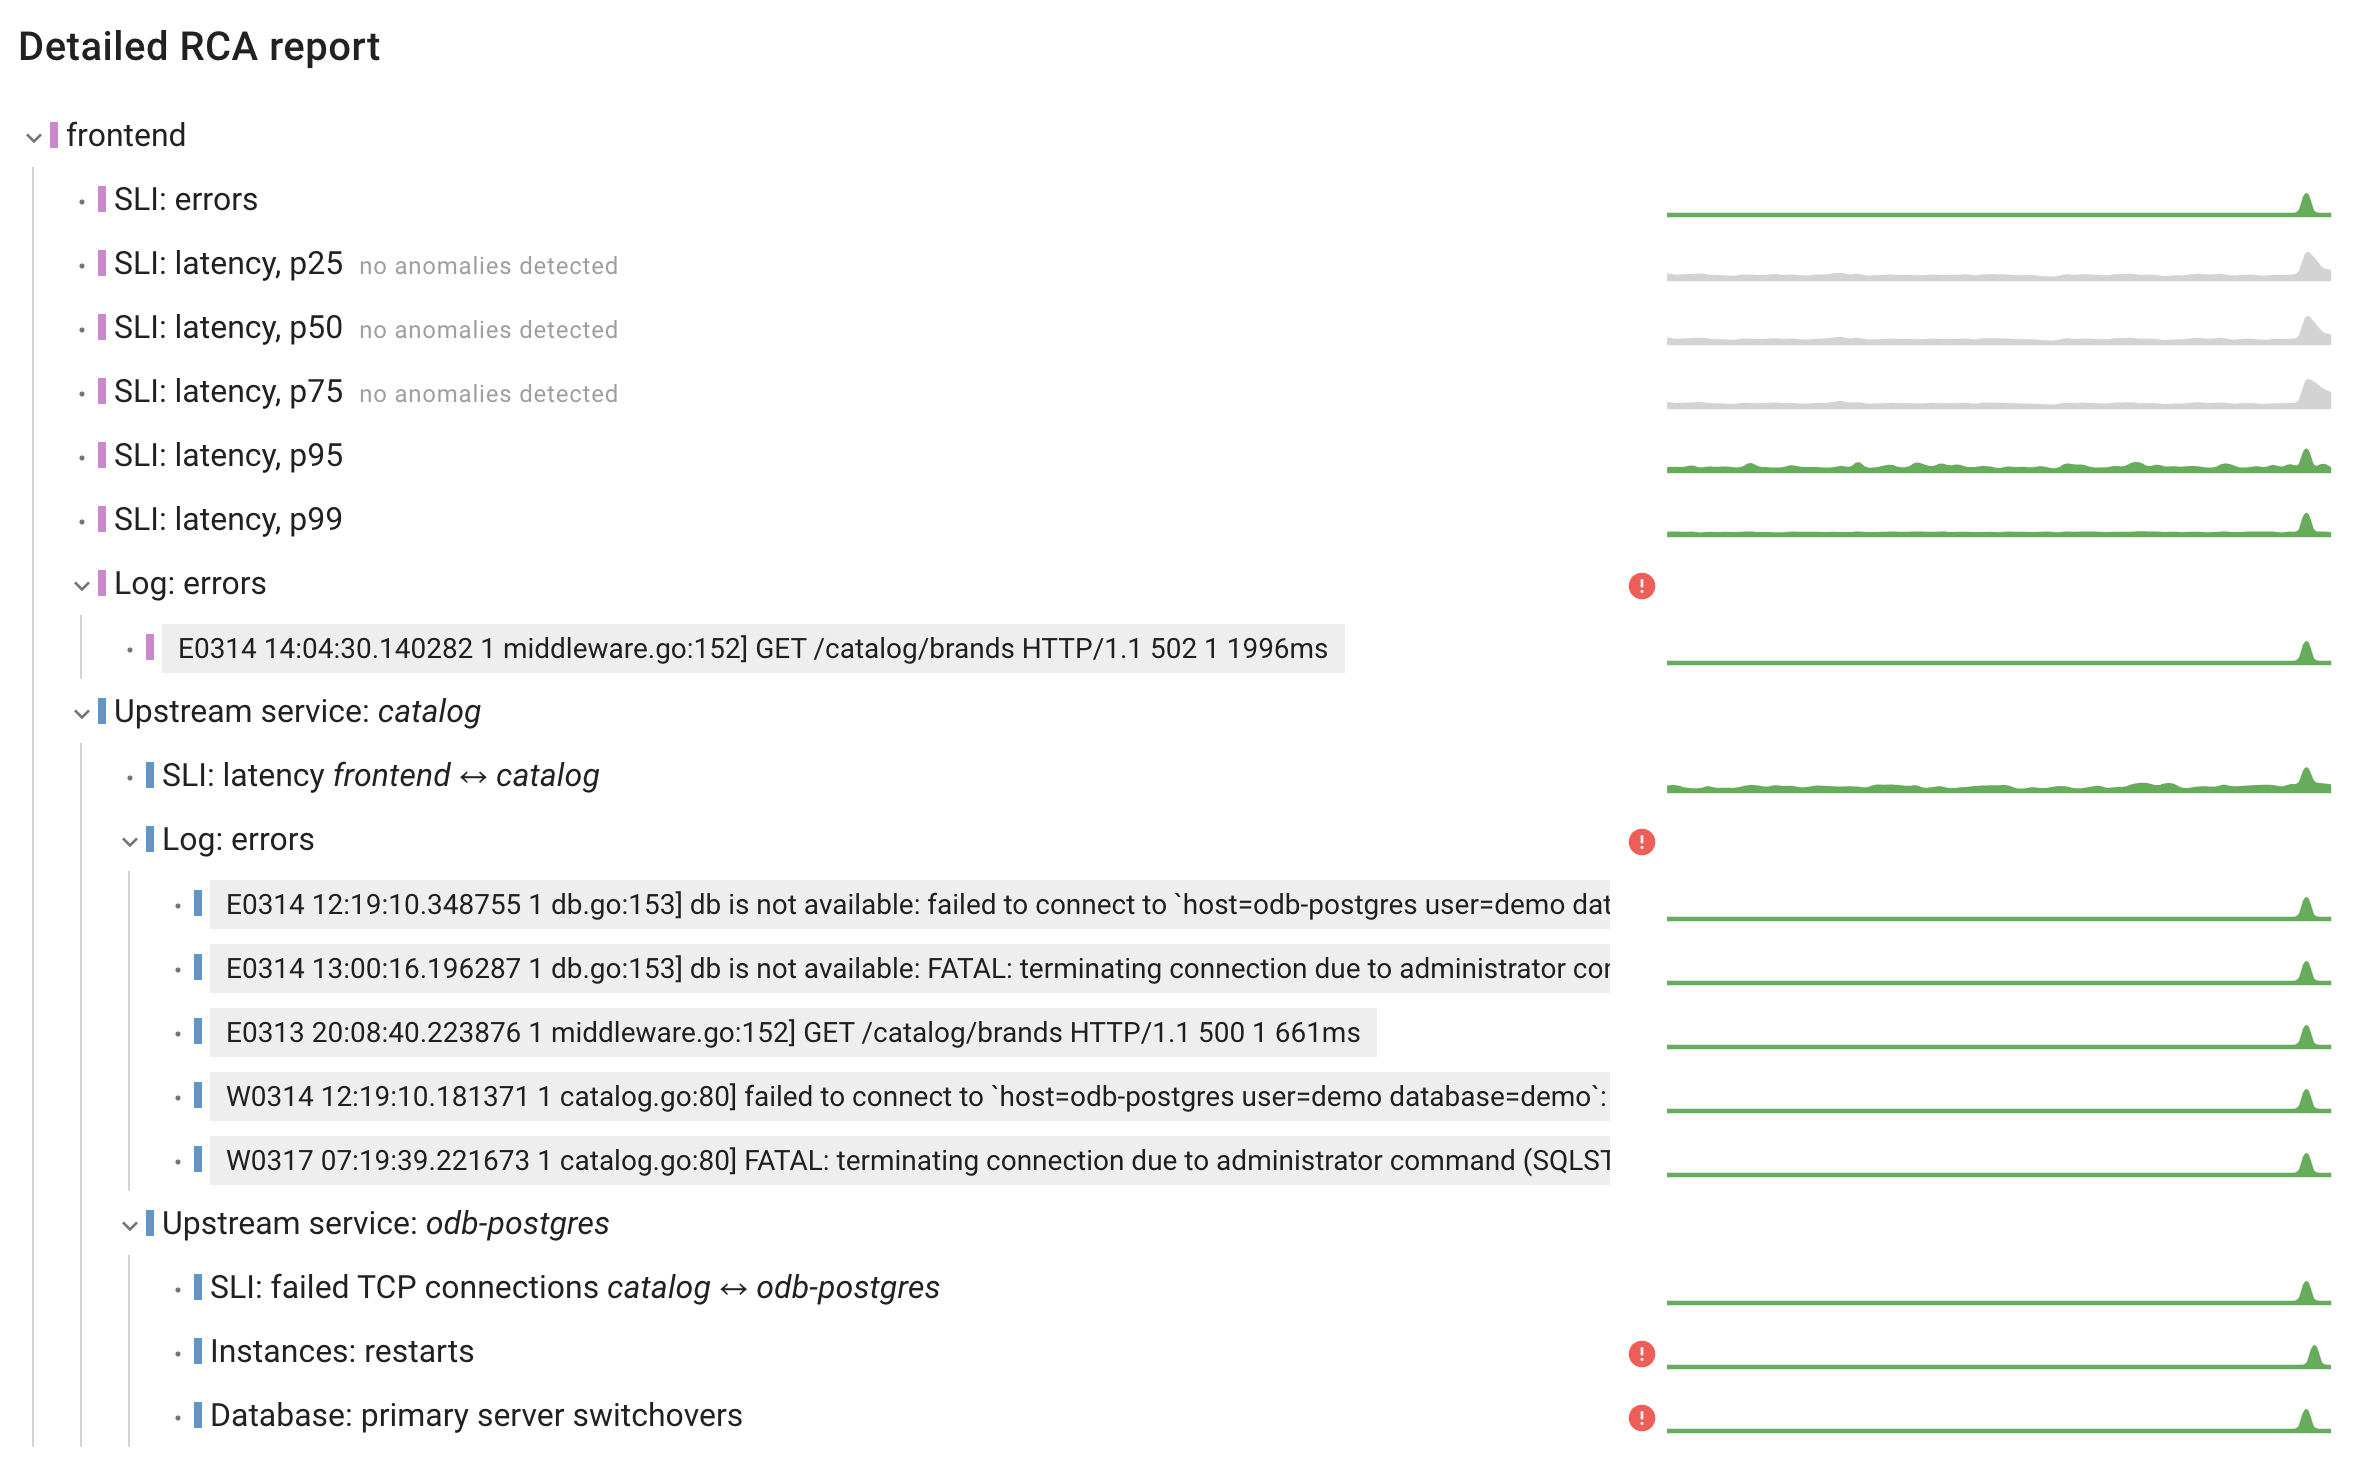
Here’s a detailed RCA report showing how Coroot analyzed this anomaly. It might look complex, but it’s useful as evidence, making it easy to cross-check the relevant anomalies.
Notes on automatic Postgres failover with Patroni
In a Kubernetes cluster with the Zalando PostgreSQL Operator and Patroni, failover is handled automatically through Patroni’s leader election using the Kubernetes API. When the primary PostgreSQL Pod is deleted, Patroni detects the failure and promotes a new primary to keep the database available:
Kubernetes notices the Pod is gone
- If the Pod was deleted manually (e.g., kubectl delete pod), or due to a node failure, Kubernetes detects that the Pod is no longer running.
- Since the Pod is managed by a StatefulSet, Kubernetes will attempt to recreate it immediately with the same name and persistent volume claim (PVC).
Patroni detects the leader is missing
- Patroni instances on replica nodes continuously monitor the leader’s health by:
- Watching Kubernetes API leader annotations.
- Checking direct TCP connectivity to the primary.
- If the leader fails health checks and doesn’t respond within a few seconds, Patroni declares it as failed and initiates a failover.
Patroni promotes a new primary
- Patroni selects the most up-to-date replica (lowest replication lag) and promotes it to primary.
- It updates the leader annotation in Kubernetes, signaling that a new primary is active.
- The new primary starts accepting read/write transactions
Kubernetes brings back the deleted Pod
- The StatefulSet recreates the deleted Pod with the same PVC.
- When PostgreSQL starts inside the Pod, it thinks it is still the primary because it has the same data directory as before.
Patroni handles split-brain prevention
- Patroni running in the restarted Pod checks the leader annotation in Kubernetes and realizes that a new primary has already been elected.
- To prevent split-brain, Patroni forces the old Pod to demote itself to a replica:
- PostgreSQL enters recovery mode and starts streaming replication from the new primary.
- If the old primary’s timeline diverged before deletion, Patroni forces a base backup to resynchronize it.
Service and connection rerouting
- The Zalando PostgreSQL Operator provides a Kubernetes Service that dynamically points to the current primary.
- When Patroni promotes a new primary, the Operator automatically updates the Service’s Endpoints, ensuring:
- Applications connecting via the Service are routed to the new primary.
- The old primary (when restarted) is no longer in the write path.
Conclusion
This incident was a great reminder that failover works, but it’s not seamless. Coroot’s RCA quickly traced the issue from frontend errors back to the database switchover, showing how failures can ripple through a system. While Patroni and Kubernetes automate failover, a few seconds of downtime can still cause errors, especially if applications aren’t designed to handle it smoothly. Connection pooling and retries make a big difference in preventing disruptions, and good observability helps pinpoint issues fast. Learning from real incidents like this helps us build more resilient and reliable systems.